
Build a cost estimate
Learn Finance · Project & Cost Finance · Task A1. Turn the scope into a number you can defend — with the right method and an honest range.
Also drill the formulas as flashcards in PMP Reps → Finance · Cost & EVM.
What it is
A cost estimate answers "how much will this cost?" — and the honest answer is always a method plus a range, never a lone number. PMBOK's Estimate Costs process gives three core techniques; which one fits depends on how much you already know, so they run roughest-and-fastest to slowest-and-most-accurate.
Analogous (top-down). Take the actual cost of a similar past project and adjust it for differences in size or complexity, using expert judgement. It needs almost no detail and is often the only method available before the scope exists — fast, but rough. Example: last year's payments platform actually cost $1.8M; Meridian is ~15% larger in scope → ≈ $2.1M as an opening figure. One analogue, one judgement adjustment, minutes of work — no WBS required.
Parametric. Multiply a statistical unit rate × quantity, where the rate comes from historical data. As accurate as that rate data, and it scales to any size. Example: the team's history shows $1,400 per function point; Meridian is sized at 1,400 function points → $1,960,000. Double the function points and the number doubles — the rate is the anchor, so the model scales linearly.
Bottom-up. Decompose the work to the work-package level, estimate each package, then sum upward. The most effort and the most accurate, because every dollar is tied to real scope — but it needs a firm WBS first. Example: Meridian priced per WBS branch — design $300k · build $1,100k · integration $350k · testing $150k · rollout $100k → $2,000,000 (the full walk is in the example below).
Three-point / PERT is not a fourth method — it's a technique you layer on top of any of
the above for an uncertain item. Estimate a range — Optimistic (O), Most-likely (M),
Pessimistic (P) — and weight it toward the most likely:
PERT (expected) = (O + 4M + P) ÷ 6, standard deviation (P − O) ÷ 6.
It cancels the optimism baked into a single guess and makes the spread explicit.
Example: integration is guessed at 12 weeks, but realistically 8 (best) to 28 (worst) →
PERT = (8 + 48 + 28)/6 = 14 weeks, SD ≈ 3.3 weeks — the long tail that a flat "12 weeks"
would have hidden.
Reference. The three estimating methods and three-point estimating are tools & techniques of the Estimate Costs process in the PMBOK® Guide (Cost performance domain). The accuracy classes a number carries — ROM → Budgetary → Definitive (see the numbers) — come from AACE International (Recommended Practice 17R-97).
Which method, when
| Method | How it works | Performs well when | Typical accuracy | Effort / speed |
|---|---|---|---|---|
| Analogous | a similar past project, adjusted | scope is still vague and you need a number now — and a good analogue exists | low (ROM-ish) | lowest / fastest |
| Parametric | unit rate × quantity | the work is repeatable and you have reliable historical rate data | medium–high (scales with the rate) | low–medium |
| Bottom-up | estimate every work package, sum up | the WBS is firm and accuracy matters (funding ask, baseline) | highest | highest / slowest |
| Three-point / PERT | O, M, P weighted — layered on any method above | any item is genuinely uncertain and a single guess would mislead | de-biases and bounds the estimate | low (two extra guesses) |
In real projects you combine them: an analogous figure to open the conversation, parametric for the repeatable bulk, bottom-up for the parts whose scope is firm, and three-point on whatever stays uncertain.
Why it matters
- A number drives the budget and the funding ask. A shaky estimate means a budget that fails the first time reality tests it.
- A single figure is false precision. Quoting "$2,000,000" with no range implies a certainty you don't have early on. Ranges are honest — and they tighten as scope firms up.
- It's the baseline everything is measured against (A2 → A5). Get the estimate wrong and every variance downstream is measuring against a bad reference.
Where you do it in VanillaPM
Everything below is in Project → Estimate (apps/estimation). A step-by-step for the
Meridian build:
-
Start the estimate. Click New estimate — or Recommend from history for an analogous opening figure: the recommender matches Meridian against similar past projects (
HistoricalProject/EstimationBenchmark) and proposes a recommended cost + a suggested buffer %. Good for the first ballpark before any WBS exists.
Step 1 — start a New estimate, or Recommend from history for an analogous opening figure -
Add the lines — two methods, side by side. The estimate has a Bottom-up (WBS) tab and a Top-down (parametric) tab, so you can build the same number two ways and compare: - Bottom-up: pick a WBS node, a resource rate (a standard grade — never an individual's salary) and the hours → the line cost is rate × hours. This is Meridian's design $300k · build $1,100k · … rolled up from real work packages. - Top-down: a driver label, a driver count × effort-per-driver (the parametric "$1,400 × 1,400 function points" shape).
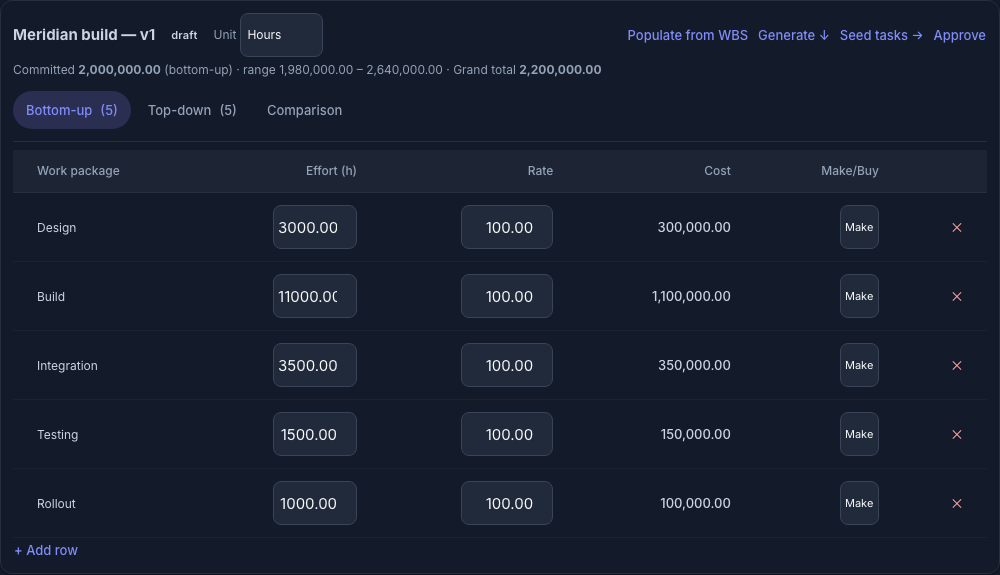
Step 2 — Meridian's bottom-up lines priced from resource rates (never salaries), with the Bottom-up / Top-down / Comparison tabs -
Read the range, not just the point. Each estimate shows its committed total, the optimistic–pessimistic range (the scenarios), and the grand total. For an uncertain line, the three-point / PERT and triangular readouts with confidence bands (±1/2/3σ) come from
apps/core/pert.py— so "integration = 14 weeks ± 3.3" is computed, not guessed.
Step 3 — the committed total with its optimistic–pessimistic range and grand total -
Reconcile and commit a method. The reconciliation view puts the bottom-up and top-down totals next to each other, each tagged with its accuracy band (bottom-up ±5/10%, top-down −15/+25%). Pick the one that becomes the number — that's the estimate's committed method.
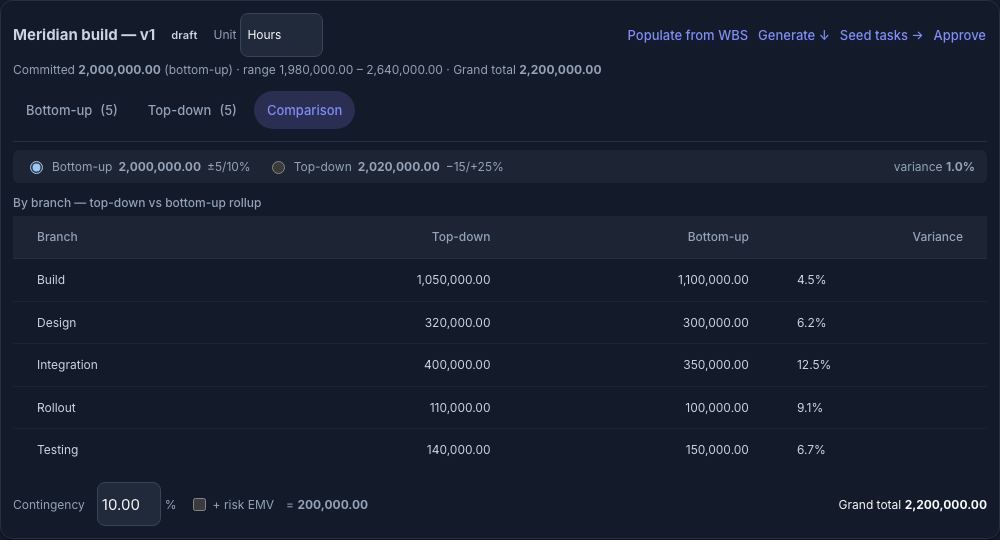
Step 4 — reconcile bottom-up vs top-down, each tagged with its accuracy band, plus the per-branch variance -
Size the contingency explicitly. Add a flat contingency % and/or + risk EMV (Σ probability × cost impact, pulled from the Risk Register) — a named reserve on top of the estimate, never padding hidden inside the lines.

Step 5 — size the contingency with a flat % and/or risk EMV; it rolls into the grand total -
Approve → it becomes the baseline. Approving the estimate creates the cost baseline and the budget entry everything downstream measures against (A2). Draft estimates stay editable; approval locks the number.
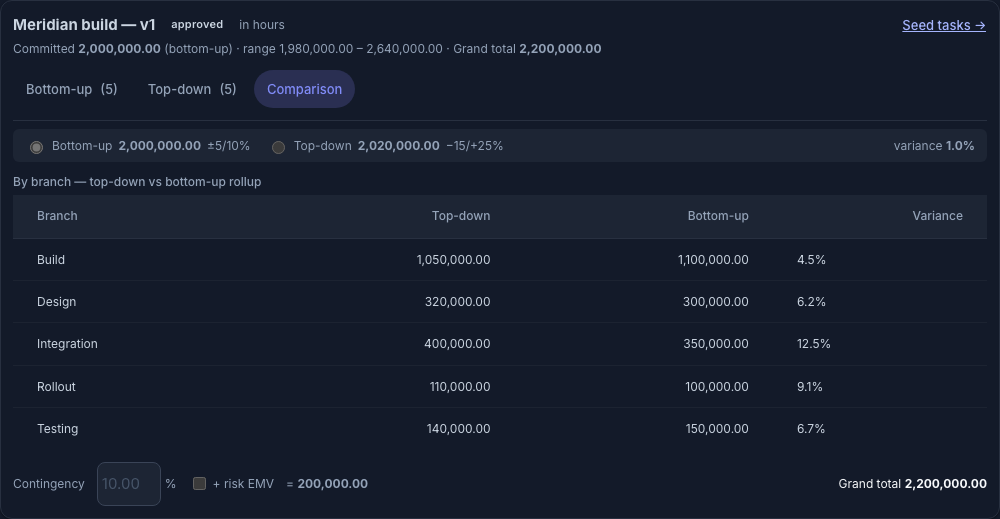
Step 6 — approved: the estimate is locked and has become the cost baseline the budget measures against
Walked example — Meridian (a fintech platform build)
A multinational is building Meridian, an internal payments platform, over 18 months. (Figures illustrative until the CR-103 corporate seed lands.)
Bottom-up from the WBS: design $300k · build $1,100k · integration $350k · testing $150k · rollout $100k → $2,000,000. For the riskiest work package (integration) the team gives a three-point estimate:
| Optimistic | Most-likely | Pessimistic | PERT | |
|---|---|---|---|---|
| Integration (weeks) | 8 | 12 | 28 | (8 + 48 + 28)/6 = 14 |
SD = (28 − 8)/6 ≈ 3.3 weeks — so ~68% of the time it lands in 14 ± 3.3 weeks. A plain single guess of "12 weeks" would have hidden that long tail.
The numbers
The estimate's bottom line is the BAC-to-be: $2,000,000. Its accuracy class matters as much as the figure — at this (definitive) stage, roughly −5% to +10%, i.e. $1.90M–$2.20M:
| Class | When | Range |
|---|---|---|
| ROM (rough order of magnitude) | earliest | −25% / +75% |
| Budgetary | scope forming | −10% / +25% |
| Definitive | scope firm | −5% / +10% |
Controls & assurance
What makes an estimate defensible to a sponsor or PMO: - A basis of estimate — the assumptions, method, rates, and range behind the number. - Resource rates, not salaries — costs priced from standard grades keep the estimate consistent and privacy-safe. - A stated accuracy class — never a bare point number pretending to be definitive. - Traceability to the WBS — every dollar tied to a work package.
Best practices & pitfalls
- Do match the method to what you know — analogous early, bottom-up once the WBS is firm.
- Do keep the basis of estimate; it's what lets you defend (and re-use) the number.
- Pitfall: a single figure with no range. It reads as certainty you don't have and sets a baseline you can't hit.
- Pitfall: padding every line "to be safe." That's hidden contingency — size reserves explicitly instead (A2).
Practise question
Q1. A task has O = 10, M = 16, P = 40 days. What's the PERT estimate and the standard deviation, and which single-point guess would be misleading?
Answer: PERT = (10 + 64 + 40)/6 = 19 days; SD = (40 − 10)/6 = 5 days. A naive "16 days" (the most-likely) ignores the long pessimistic tail — PERT's weighting pulls the expected value to 19, and the ±5 SD tells you how wide the uncertainty really is.
Terms used here
- Analogous / parametric / bottom-up — the three estimating methods.
- Three-point / PERT — an estimate from optimistic/most-likely/pessimistic, weighting the most-likely ×4.
- Basis of estimate — the documented assumptions/method/range behind the number.
- Estimate class (ROM/Budgetary/Definitive) — the accuracy band for the estimate's maturity.
- Related: Set the cost baseline — where the approved estimate becomes the measuring stick.
Who reads the estimate — and what to show each of them
A cost estimate has several audiences, and each needs the number at a different altitude. Showing an executive your 40-line bottom-up is as wrong as handing the delivery team a single headline figure. Match what you present to what they're deciding:
| Stakeholder | What they're deciding | What to present |
|---|---|---|
| Sponsor / Executive (the funder) | Fund it or not — is the return worth the spend? | The headline number with its range and class ("$2.0M, −5%/+10% at definitive"), tied to the business-case return. Not the line detail. |
| PMO / Portfolio governance | Can we trust this estimate — is it done properly? | The basis of estimate: method, rates, assumptions, accuracy class, and the bottom-up vs top-down reconciliation + how it benchmarks against similar past projects. |
| Finance / Controller | Can we fund the cash flow, and are reserves right? | The approved cost baseline, its time-phasing / S-curve, and reserves — contingency vs management reserve (A2). |
| Delivery leads / team | Is this achievable, and where's the risk? | The bottom-up work-package lines, the assumptions, and the three-point items — so they can pressure-test what's uncertain. |
| Client / Customer (if external) | Is the price and scope acceptable? | The committed figure + what's in scope and what triggers a change. Not your internal reserves or margins. |
| Change Control Board (on a re-baseline) | Approve the new number? | The re-estimate, the variance vs the old baseline, and why it moved. |
Rule of thumb: executives get the number + range + confidence; the PMO gets the basis; the team gets the lines. Everyone gets a stated method and an honest range — an estimate you can't explain is an estimate they can't fund, and the maturity class tells each of them how much to trust it today (it tightens as the project learns).